2 System Monitoring Utilities #Edit source
There are number of programs, tools, and utilities which you can use to examine the status of your system. This chapter introduces some and describes their most important and frequently used parameters.
For each of the described commands, examples of the relevant outputs are
presented. In the examples, the first line is the command itself (after
the tux > or root #). Omissions are indicated with
square brackets ([...]) and long lines are wrapped
where necessary. Line breaks for long lines are indicated by a backslash
(\).
tux > command -x -y
output line 1
output line 2
output line 3 is annoyingly long, so long that \
    we need to break it
output line 4
[...]
output line 98
output line 99
The descriptions have been kept short so that we can include as many
utilities as possible. Further information for all the commands can be
found in the manual pages. Most of the commands also understand the
parameter --help, which produces a brief list of possible
parameters.
2.1 Multi-Purpose Tools #Edit source
While most Linux system monitoring tools monitor only a single aspect of the system, there are a few tools with a broader scope. To get an overview and find out which part of the system to examine further, use these tools first.
2.1.1 vmstat #Edit source
vmstat collects information about processes, memory, I/O, interrupts and CPU:
vmstat [options] [delay [count]]
When called without values for delay and count, it displays average values since the last reboot. When called with a value for delay (in seconds), it displays values for the given period (two seconds in the examples below). The value for count specifies the number of updates vmstat should perform. If not specified, it will run until manually stopped.
Example 2.1: vmstat Output on a Lightly Used Machine #
tux > vmstat 2
procs -----------memory---------- ---swap-- -----io---- -system-- ------cpu-----
 r  b   swpd   free   buff  cache   si   so    bi    bo   in   cs us sy id wa st
 1  0  44264  81520    424 935736    0    0    12    25   27   34  1  0 98   0  0
 0  0  44264  81552    424 935736    0    0     0     0   38   25  0  0 100  0  0
 0  0  44264  81520    424 935732    0    0     0     0   23   15  0  0 100  0  0
 0  0  44264  81520    424 935732    0    0     0     0   36   24  0  0 100  0  0
 0  0  44264  81552    424 935732    0    0     0     0   51   38  0  0 100  0  0
Example 2.2: vmstat Output on a Heavily Used Machine (CPU bound) #
tux > vmstat 2
procs -----------memory----------- ---swap-- -----io---- -system-- -----cpu------
 r  b   swpd   free   buff   cache   si   so    bi    bo   in   cs us sy id wa st
32  1  26236 459640 110240 6312648    0    0  9944     2 4552 6597 95  5  0  0  0
23  1  26236 396728 110336 6136224    0    0  9588     0 4468 6273 94  6  0  0  0
35  0  26236 554920 110508 6166508    0    0  7684 27992 4474 4700 95  5  0  0  0
28  0  26236 518184 110516 6039996    0    0 10830     4 4446 4670 94  6  0  0  0
21  5  26236 716468 110684 6074872    0    0  8734 20534 4512 4061 96  4  0  0  0
Tip: First Line of Output
The first line of the vmstat output always displays average values since the last reboot.
The columns show the following:
Shows the number of processes in a runnable state. These processes are either executing or waiting for a free CPU slot. If the number of processes in this column is constantly higher than the number of CPUs available, this may be an indication of insufficient CPU power.
Shows the number of processes waiting for a resource other than a CPU. A high number in this column may indicate an I/O problem (network or disk).
The amount of swap space (KB) currently used.
The amount of unused memory (KB).
Recently unused memory that can be reclaimed. This column is only visible when calling
vmstatwith the parameter-a(recommended).Recently used memory that normally does not get reclaimed. This column is only visible when calling
vmstatwith the parameter-a(recommended).File buffer cache (KB) in RAM that contains file system metadata. This column is not visible when calling
vmstatwith the parameter-a.Page cache (KB) in RAM with the actual contents of files. This column is not visible when calling
vmstatwith the parameter-a.Amount of data (KB) that is moved from swap to RAM (
si) or from RAM to swap (so) per second. Highsovalues over a long period of time may indicate that an application is leaking memory and the leaked memory is being swapped out. Highsivalues over a long period of time could mean that an application that was inactive for a very long time is now active again. Combined highsiandsovalues for prolonged periods of time are evidence of swap thrashing and may indicate that more RAM needs to be installed in the system because there is not enough memory to hold the working set size.Number of blocks per second received from a block device (for example, a disk read). Note that swapping also impacts the values shown here. The block size may vary between file systems but can be determined using the stat utility. If throughput data is required then iostat may be used.
Number of blocks per second sent to a block device (for example, a disk write). Note that swapping also impacts the values shown here.
Interrupts per second. A high value may indicate a high I/O level (network and/or disk), but could also be triggered for other reasons such as inter-processor interrupts triggered by another activity. Make sure to also check
/proc/interruptsto identify the source of interrupts.Number of context switches per second. This is the number of times that the kernel replaces executable code of one program in memory with that of another program.
Percentage of CPU usage executing application code.
Percentage of CPU usage executing kernel code.
Percentage of CPU time spent idling. If this value is zero over a longer time, your CPU(s) are working to full capacity. This is not necessarily a bad sign—rather refer to the values in columns and to determine if your machine is equipped with sufficient CPU power.
If "wa" time is non-zero, it indicates throughput lost because of waiting for I/O. This may be inevitable, for example, if a file is being read for the first time, background writeback cannot keep up, and so on. It can also be an indicator for a hardware bottleneck (network or hard disk). Lastly, it can indicate a potential for tuning the virtual memory manager (refer to Chapter 14, Tuning the Memory Management Subsystem).
Percentage of CPU time stolen from a virtual machine.
See vmstat --help for more options.
2.1.2 dstat #Edit source
dstat is a replacement for tools such as
vmstat, iostat,
netstat, or ifstat.
dstat displays information about the system
resources in real time. For example, you can compare disk usage
in combination with interrupts from the IDE controller, or compare
network bandwidth with the disk throughput (in the same interval).
By default, its output is presented in readable tables. Alternatively, CSV output can be produced which is suitable as a spreadsheet import format.
It is written in Python and can be enhanced with plug-ins.
This is the general syntax:
dstat [-afv] [OPTIONS..] [DELAY [COUNT]]
All options and parameters are optional. Without any parameter, dstat
displays statistics about CPU (-c,
--cpu), disk (-d,
--disk), network (-n,
--net), paging (-g,
--page), and the interrupts and context switches of
the system (-y, --sys); it refreshes
the output every second ad infinitum:
root #dstatYou did not select any stats, using -cdngy by default. ----total-cpu-usage---- -dsk/total- -net/total- ---paging-- ---system-- usr sys idl wai hiq siq| read writ| recv send| in out | int csw 0 0 100 0 0 0| 15k 44k| 0 0 | 0 82B| 148 194 0 0 100 0 0 0| 0 0 |5430B 170B| 0 0 | 163 187 0 0 100 0 0 0| 0 0 |6363B 842B| 0 0 | 196 185
-a,--allequal to
-cdngy(default)-f,--fullexpand
-C,-D,-I,-Nand-Sdiscovery lists-v,--vmstatequal to
-pmgdsc,-D total
- DELAY
delay in seconds between each update
- COUNT
the number of updates to display before exiting
The default delay is 1 and the count is unspecified (unlimited).
For more information, see the man page of dstat and
its Web page at http://dag.wieers.com/home-made/dstat/.
2.1.3 System Activity Information: sar #Edit source
sar can generate extensive reports on almost all
important system activities, among them CPU, memory, IRQ usage, IO, or
networking. It can also generate reports on the fly.
sar gathers all their data from the
/proc file system.
Note: sysstat Package
sar is a part of the sysstat
package either with YaST, or with zypper in
sysstat.
2.1.3.1 Generating reports with sar #Edit source
To generate reports on the fly, call sar with an
interval (seconds) and a count. To generate reports from files specify
a file name with the option -f instead of interval and
count. If file name, interval and count are not specified,
sar attempts to generate a report from
/var/log/sa/saDD, where
DD stands for the current day. This is the
default location to where sadc (the system
activity data collector) writes its data.
Query multiple files with multiple -f options.
sar 2 10                         # on-the-fly report, 10 times every 2 seconds
sar -f ~/reports/sar_2014_07_17  # queries file sar_2014_07_17
sar                              # queries file from today in /var/log/sa/
cd /var/log/sa && \
sar -f sa01 -f sa02              # queries files /var/log/sa/0[12]
Find examples for useful sar calls and their
interpretation below. For detailed information on the meaning of each
column, refer to the man (1) of
sar.
Note: sysstat Reporting When the Service Stops
When the sysstat service is stopped (for example, during
reboot or shutdown), the tool still collects last-minute statistics by
automatically running the /usr/lib64/sa/sa1 -S ALL 1 1
command. The collected binary data is stored in the system activity data
file.
2.1.3.1.1 CPU Usage Report: sar #Edit source
When called with no options, sar shows a basic
report about CPU usage. On multi-processor machines, results for all
CPUs are summarized. Use the option -P ALL to also
see statistics for individual CPUs.
root # sar 10 5
Linux 4.4.21-64-default (jupiter)         10/12/16        _x86_64_        (2 CPU)

17:51:29        CPU     %user     %nice   %system   %iowait    %steal     %idle
17:51:39        all     57,93      0,00      9,58      1,01      0,00     31,47
17:51:49        all     32,71      0,00      3,79      0,05      0,00     63,45
17:51:59        all     47,23      0,00      3,66      0,00      0,00     49,11
17:52:09        all     53,33      0,00      4,88      0,05      0,00     41,74
17:52:19        all     56,98      0,00      5,65      0,10      0,00     37,27
Average: all 49,62 0,00 5,51 0,24 0,00 44,62displays the percentage of time that the CPU was idle while waiting for an I/O request. If this value is significantly higher than zero over a longer time, there is a bottleneck in the I/O system (network or hard disk). If the value is zero over a longer time, your CPU is working at capacity.
2.1.3.1.2 Memory Usage Report: sar -r #Edit source
Generate an overall picture of the system memory (RAM) by using the
option -r:
root # sar -r 10 5
Linux 4.4.21-64-default (jupiter)         10/12/16        _x86_64_        (2 CPU)

17:55:27 kbmemfree kbmemused %memused kbbuffers kbcached kbcommit %commit kbactive kbinact kbdirty
17:55:37    104232   1834624    94.62        20   627340  2677656   66.24   802052  828024    1744
17:55:47     98584   1840272    94.92        20   624536  2693936   66.65   808872  826932    2012
17:55:57     87088   1851768    95.51        20   605288  2706392   66.95   827260  821304    1588
17:56:07     86268   1852588    95.55        20   599240  2739224   67.77   829764  820888    3036
17:56:17    104260   1834596    94.62        20   599864  2730688   67.56   811284  821584    3164
Average:     96086   1842770    95.04        20   611254  2709579   67.03   815846  823746    2309
The columns and show an approximation of the maximum amount of memory (RAM and swap) that the current workload could need. While displays the absolute number in kilobytes, displays a percentage.
2.1.3.1.3 Paging Statistics Report: sar -B #Edit source
Use the option -B to display the kernel paging
statistics.
root # sar -B 10 5
Linux 4.4.21-64-default (jupiter)         10/12/16        _x86_64_        (2 CPU)

18:23:01 pgpgin/s pgpgout/s fault/s majflt/s pgfree/s pgscank/s pgscand/s pgsteal/s %vmeff
18:23:11   366.80     11.60  542.50     1.10  4354.80      0.00      0.00      0.00   0.00
18:23:21     0.00    333.30 1522.40     0.00 18132.40      0.00      0.00      0.00   0.00
18:23:31    47.20    127.40 1048.30     0.10 11887.30      0.00      0.00      0.00   0.00
18:23:41    46.40      2.50  336.10     0.10  7945.00      0.00      0.00      0.00   0.00
18:23:51     0.00    583.70 2037.20     0.00 17731.90      0.00      0.00      0.00   0.00
Average:    92.08    211.70 1097.30     0.26 12010.28      0.00      0.00      0.00   0.00
The (major faults per second) column shows how many pages are loaded from disk into memory. The source of the faults may be file accesses or faults. At times, many major faults are normal. For example, during application start-up time. If major faults are experienced for the entire lifetime of the application it may be an indication that there is insufficient main memory, particularly if combined with large amounts of direct scanning (pgscand/s).
The column shows the number of pages scanned () in relation to the ones being reused from the main memory cache or the swap cache (). It is a measurement of the efficiency of page reclaim. Healthy values are either near 100 (every inactive page swapped out is being reused) or 0 (no pages have been scanned). The value should not drop below 30.
2.1.3.1.4 Block Device Statistics Report: sar -d #Edit source
Use the option -d to display the block device (hard
disk, optical drive, USB storage device, etc.). Make sure to use the
additional option -p (pretty-print) to make the
column readable.
root # sar -d -p 10 5
 Linux 4.4.21-64-default (jupiter)         10/12/16        _x86_64_        (2 CPU)

18:46:09 DEV   tps rd_sec/s  wr_sec/s  avgrq-sz  avgqu-sz     await     svctm     %util
18:46:19 sda  1.70    33.60      0.00     19.76      0.00      0.47      0.47      0.08
18:46:19 sr0  0.00     0.00      0.00      0.00      0.00      0.00      0.00      0.00

18:46:19 DEV   tps rd_sec/s  wr_sec/s  avgrq-sz  avgqu-sz     await     svctm     %util
18:46:29 sda  8.60   114.40    518.10     73.55      0.06      7.12      0.93      0.80
18:46:29 sr0  0.00     0.00      0.00      0.00      0.00      0.00      0.00      0.00

18:46:29 DEV   tps rd_sec/s  wr_sec/s  avgrq-sz  avgqu-sz     await     svctm     %util
18:46:39 sda 40.50  3800.80    454.90    105.08      0.36      8.86      0.69      2.80
18:46:39 sr0  0.00     0.00      0.00      0.00      0.00      0.00      0.00      0.00

18:46:39 DEV   tps rd_sec/s  wr_sec/s  avgrq-sz  avgqu-sz     await     svctm     %util
18:46:49 sda  1.40     0.00    204.90    146.36      0.00      0.29      0.29      0.04
18:46:49 sr0  0.00     0.00      0.00      0.00      0.00      0.00      0.00      0.00

18:46:49 DEV   tps rd_sec/s  wr_sec/s  avgrq-sz  avgqu-sz     await     svctm     %util
18:46:59 sda  3.30     0.00    503.80    152.67      0.03      8.12      1.70      0.56
18:46:59 sr0  0.00     0.00      0.00      0.00      0.00      0.00      0.00      0.00

Average: DEV   tps rd_sec/s  wr_sec/s  avgrq-sz  avgqu-sz     await     svctm     %util
Average: sda 11.10   789.76    336.34    101.45      0.09      8.07      0.77      0.86
Average: sr0  0.00     0.00      0.00      0.00      0.00      0.00      0.00      0.00
Compare the values for , , and of all disks. Constantly high values in the and columns could be an indication that I/O subsystem is a bottleneck.
If the machine uses multiple disks, then it is best if I/O is interleaved evenly between disks of equal speed and capacity. It will be necessary to take into account whether the storage has multiple tiers. Furthermore, if there are multiple paths to storage then consider what the link saturation will be when balancing how storage is used.
2.1.3.1.5 Network Statistics Reports: sar -n KEYWORD #Edit source
The option -n lets you generate multiple network
related reports. Specify one of the following keywords along with the
-n:
DEV: Generates a statistic report for all network devices
EDEV: Generates an error statistics report for all network devices
NFS: Generates a statistic report for an NFS client
NFSD: Generates a statistic report for an NFS server
SOCK: Generates a statistic report on sockets
ALL: Generates all network statistic reports
2.1.3.2 Visualizing sar Data #Edit source
sar reports are not always easy to parse for humans.
kSar, a Java application visualizing your sar data,
creates easy-to-read graphs. It can even generate PDF reports. kSar
takes data generated on the fly and past data from a file. kSar
is licensed under the BSD license and is available from
https://sourceforge.net/projects/ksar/.
2.2 System Information #Edit source
2.2.1 Device Load Information: iostat #Edit source
To monitor the system device load, use iostat. It
generates reports that can be useful for better balancing the load
between physical disks attached to your system.
To be able to use iostat, install the package
sysstat.
The first iostat report shows statistics collected
since the system was booted. Subsequent reports cover the time since the
previous report.
tux > iostat
Linux 4.4.21-64-default (jupiter)         10/12/16        _x86_64_        (4 CPU)

avg-cpu:  %user   %nice %system %iowait  %steal   %idle
          17.68    4.49    4.24    0.29    0.00   73.31

Device:            tps    kB_read/s    kB_wrtn/s    kB_read    kB_wrtn
sdb               2.02        36.74        45.73    3544894    4412392
sda               1.05         5.12        13.47     493753    1300276
sdc               0.02         0.14         0.00      13641         37
Invoking iostat in this way will help you find out
whether throughput is different from your expectation, but not why.
Such questions can be better answered by an extended report which can be
generated by invoking iostat -x.
Extended reports additionally include, for example, information on average
queue sizes and average wait times.
It may also be easier to evaluate the data if idle block devices are
excluded using the -z switch.
Find definitions for each of the displayed column titles in the
man page of iostat (man 1 iostat).
You can also specify that a certain device should be monitored at specified
intervals.
For example, to generate five reports at three-second intervals for the
device sda, use:
tux >iostat-p sda 3 5
To show statistics of network file systems (NFS), there are two similar utilities:
nfsiostat-sysstatis included with the package sysstat.nfsiostatis included with the package nfs-client.
2.2.2 Processor Activity Monitoring: mpstat #Edit source
The utility mpstat examines activities of each
available processor. If your system has one processor only, the global
average statistics will be reported.
The timing arguments work the same way as with the
iostat command. Entering mpstat 2
5 prints five reports for all processors in two-second
intervals.
root # mpstat 2 5
Linux 4.4.21-64-default (jupiter)         10/12/16        _x86_64_        (2 CPU)

13:51:10  CPU   %usr  %nice  %sys  %iowait  %irq  %soft  %steal  %guest  %gnice   %idle
13:51:12  all   8,27   0,00  0,50     0,00  0,00   0,00    0,00    0,00    0,00   91,23
13:51:14  all  46,62   0,00  3,01     0,00  0,00   0,25    0,00    0,00    0,00   50,13
13:51:16  all  54,71   0,00  3,82     0,00  0,00   0,51    0,00    0,00    0,00   40,97
13:51:18  all  78,77   0,00  5,12     0,00  0,00   0,77    0,00    0,00    0,00   15,35
13:51:20  all  51,65   0,00  4,30     0,00  0,00   0,51    0,00    0,00    0,00   43,54
Average:  all  47,85   0,00  3,34     0,00  0,00   0,40    0,00    0,00    0,00   48,41
From the mpstat data, you can see:
The ratio between the and . For example, a ratio of 10:1 indicates the workload is mostly running application code and analysis should focus on the application. A ratio of 1:10 indicates the workload is mostly kernel-bound and tuning the kernel is worth considering. Alternatively, determine why the application is kernel-bound and see if that can be alleviated.
Whether there is a subset of CPUs that are nearly fully utilized even if the system is lightly loaded overall. Few hot CPUs can indicate that the workload is not parallelized and could benefit from executing on a machine with a smaller number of faster processors.
2.2.3 Processor Frequency Monitoring: turbostat #Edit source
turbostat shows frequencies, load, temperature, and power
of AMD64/Intel 64 processors. It can operate in two modes: If called
with a command, the command process is forked and statistics are displayed
upon command completion. When run without a command, it will display
updated statistics every five seconds. Note that
turbostat requires the kernel module
msr to be loaded.
tux >sudoturbostat find /etc -type d -exec true {} \; 0.546880 sec CPU Avg_MHz Busy% Bzy_MHz TSC_MHz - 416 28.43 1465 3215 0 631 37.29 1691 3215 1 416 27.14 1534 3215 2 270 24.30 1113 3215 3 406 26.57 1530 3214 4 505 32.46 1556 3214 5 270 22.79 1184 3214
The output depends on the CPU type and may vary. To display more details
such as temperature and power, use the --debug option. For
more command line options and an explanation of the field descriptions,
refer to man 8 turbostat.
2.2.4 Task Monitoring: pidstat #Edit source
If you need to see what load a particular task applies to your system,
use pidstat command. It prints activity of every
selected task or all tasks managed by Linux kernel if no task is
specified. You can also set the number of reports to be displayed and
the time interval between them.
For example, pidstat -C firefox 2 3
prints the load statistic for tasks whose command name includes the
string “firefox”. There will be three reports printed at
two second intervals.
root # pidstat -C firefox 2 3
Linux 4.4.21-64-default (jupiter)         10/12/16        _x86_64_        (2 CPU)

14:09:11      UID       PID    %usr %system  %guest    %CPU   CPU  Command
14:09:13     1000       387   22,77    0,99    0,00   23,76     1  firefox

14:09:13      UID       PID    %usr %system  %guest    %CPU   CPU  Command
14:09:15     1000       387   46,50    3,00    0,00   49,50     1  firefox

14:09:15      UID       PID    %usr %system  %guest    %CPU   CPU  Command
14:09:17     1000       387   60,50    7,00    0,00   67,50     1  firefox

Average:      UID       PID    %usr %system  %guest    %CPU   CPU  Command
Average:     1000       387   43,19    3,65    0,00   46,84     -  firefox
Similarly, pidstat -d can be
used to estimate how much I/O tasks are doing, whether they are
sleeping on that I/O and how many clock ticks the task was stalled.
2.2.5 Kernel Ring Buffer: dmesg #Edit source
The Linux kernel keeps certain messages in a ring buffer. To view these
messages, enter the command dmesg -T.
Older events are logged in the systemd journal. See
Book “Reference”, Chapter 11 “journalctl: Query the systemd Journal” for more information on the journal.
2.2.6 List of Open Files: lsof #Edit source
To view a list of all the files open for the process with process ID
PID, use -p. For example, to
view all the files used by the current shell, enter:
root # lsof -p $$
COMMAND  PID USER   FD   TYPE DEVICE SIZE/OFF  NODE NAME
bash    8842 root  cwd    DIR   0,32      222  6772 /root
bash    8842 root  rtd    DIR   0,32      166   256 /
bash    8842 root  txt    REG   0,32   656584 31066 /bin/bash
bash    8842 root  mem    REG   0,32  1978832 22993 /lib64/libc-2.19.so
[...]
bash    8842 root    2u   CHR  136,2      0t0     5 /dev/pts/2
bash    8842 root  255u   CHR  136,2      0t0     5 /dev/pts/2
The special shell variable $$, whose value is the
process ID of the shell, has been used.
When used with -i, lsof lists
currently open Internet files as well:
root # lsof -i
COMMAND    PID USER   FD   TYPE DEVICE SIZE/OFF NODE NAME
wickedd-d  917 root    8u  IPv4  16627      0t0  UDP *:bootpc
wickedd-d  918 root    8u  IPv6  20752      0t0  UDP [fe80::5054:ff:fe72:5ead]:dhcpv6-client
sshd      3152 root    3u  IPv4  18618      0t0  TCP *:ssh (LISTEN)
sshd      3152 root    4u  IPv6  18620      0t0  TCP *:ssh (LISTEN)
master    4746 root   13u  IPv4  20588      0t0  TCP localhost:smtp (LISTEN)
master    4746 root   14u  IPv6  20589      0t0  TCP localhost:smtp (LISTEN)
sshd      8837 root    5u  IPv4 293709      0t0  TCP jupiter.suse.de:ssh->venus.suse.de:33619 (ESTABLISHED)
sshd      8837 root    9u  IPv6 294830      0t0  TCP localhost:x11 (LISTEN)
sshd      8837 root   10u  IPv4 294831      0t0  TCP localhost:x11 (LISTEN)
2.2.7 Kernel and udev Event Sequence Viewer: udevadm monitor #Edit source
udevadm monitor listens to the kernel uevents and
events sent out by a udev rule and prints the device path (DEVPATH) of
the event to the console. This is a sequence of events while connecting
a USB memory stick:
Note: Monitoring udev Events
Only root user is allowed to monitor udev events by running the
udevadm command.
UEVENT[1138806687] add@/devices/pci0000:00/0000:00:1d.7/usb4/4-2/4-2.2
UEVENT[1138806687] add@/devices/pci0000:00/0000:00:1d.7/usb4/4-2/4-2.2/4-2.2
UEVENT[1138806687] add@/class/scsi_host/host4
UEVENT[1138806687] add@/class/usb_device/usbdev4.10
UDEV  [1138806687] add@/devices/pci0000:00/0000:00:1d.7/usb4/4-2/4-2.2
UDEV  [1138806687] add@/devices/pci0000:00/0000:00:1d.7/usb4/4-2/4-2.2/4-2.2
UDEV  [1138806687] add@/class/scsi_host/host4
UDEV  [1138806687] add@/class/usb_device/usbdev4.10
UEVENT[1138806692] add@/devices/pci0000:00/0000:00:1d.7/usb4/4-2/4-2.2/4-2.2
UEVENT[1138806692] add@/block/sdb
UEVENT[1138806692] add@/class/scsi_generic/sg1
UEVENT[1138806692] add@/class/scsi_device/4:0:0:0
UDEV  [1138806693] add@/devices/pci0000:00/0000:00:1d.7/usb4/4-2/4-2.2/4-2.2
UDEV  [1138806693] add@/class/scsi_generic/sg1
UDEV  [1138806693] add@/class/scsi_device/4:0:0:0
UDEV  [1138806693] add@/block/sdb
UEVENT[1138806694] add@/block/sdb/sdb1
UDEV  [1138806694] add@/block/sdb/sdb1
UEVENT[1138806694] mount@/block/sdb/sdb1
UEVENT[1138806697] umount@/block/sdb/sdb1
2.3 Processes #Edit source
2.3.1 Interprocess Communication: ipcs #Edit source
The command ipcs produces a list of the IPC resources
currently in use:
root # ipcs
------ Message Queues --------
key        msqid      owner      perms      used-bytes   messages

------ Shared Memory Segments --------
key        shmid      owner      perms      bytes      nattch     status
0x00000000 65536      tux        600        524288     2          dest
0x00000000 98305      tux        600        4194304    2          dest
0x00000000 884738     root       600        524288     2          dest
0x00000000 786435     tux        600        4194304    2          dest
0x00000000 12058628   tux        600        524288     2          dest
0x00000000 917509     root       600        524288     2          dest
0x00000000 12353542   tux        600        196608     2          dest
0x00000000 12451847   tux        600        524288     2          dest
0x00000000 11567114   root       600        262144     1          dest
0x00000000 10911763   tux        600        2097152    2          dest
0x00000000 11665429   root       600        2336768    2          dest
0x00000000 11698198   root       600        196608     2          dest
0x00000000 11730967   root       600        524288     2          dest

------ Semaphore Arrays --------
key        semid      owner      perms      nsems
0xa12e0919 32768      tux        666        2
2.3.2 Process List: ps #Edit source
The command ps produces a list of processes. Most
parameters must be written without a minus sign. Refer to ps
--help for a brief help or to the man page for extensive help.
To list all processes with user and command line information, use
ps axu:
tux > ps axu
USER       PID %CPU %MEM    VSZ   RSS TTY      STAT START   TIME COMMAND
root         1  0.0  0.3  34376  4608 ?        Ss   Jul24   0:02 /usr/lib/systemd/systemd
root         2  0.0  0.0      0     0 ?        S    Jul24   0:00 [kthreadd]
root         3  0.0  0.0      0     0 ?        S    Jul24   0:00 [ksoftirqd/0]
root         5  0.0  0.0      0     0 ?        S<   Jul24   0:00 [kworker/0:0H]
root         6  0.0  0.0      0     0 ?        S    Jul24   0:00 [kworker/u2:0]
root         7  0.0  0.0      0     0 ?        S    Jul24   0:00 [migration/0]
[...]
tux      12583  0.0  0.1 185980  2720 ?        Sl   10:12   0:00 /usr/lib/gvfs/gvfs-mtp-volume-monitor
tux      12587  0.0  0.1 198132  3044 ?        Sl   10:12   0:00 /usr/lib/gvfs/gvfs-gphoto2-volume-monitor
tux      12591  0.0  0.1 181940  2700 ?        Sl   10:12   0:00 /usr/lib/gvfs/gvfs-goa-volume-monitor
tux      12594  8.1 10.6 1418216 163564 ?      Sl   10:12   0:03 /usr/bin/gnome-shell
tux      12600  0.0  0.3 393448  5972 ?        Sl   10:12   0:00 /usr/lib/gnome-settings-daemon-3.0/gsd-printer
tux      12625  0.0  0.6 227776 10112 ?        Sl   10:12   0:00 /usr/lib/gnome-control-center-search-provider
tux      12626  0.5  1.5 890972 23540 ?        Sl   10:12   0:00 /usr/bin/nautilus --no-default-window
[...]
To check how many sshd processes are running, use the
option -p together with the command
pidof, which lists the process IDs of the given
processes.
tux > ps -p $(pidof sshd)
  PID TTY      STAT   TIME COMMAND
 1545 ?        Ss     0:00 /usr/sbin/sshd -D
 4608 ?        Ss     0:00 sshd: root@pts/0
The process list can be formatted according to your needs. The option
L returns a list of all keywords. Enter the following
command to issue a list of all processes sorted by memory usage:
tux > ps ax --format pid,rss,cmd --sort rss
  PID   RSS CMD
  PID   RSS CMD
    2     0 [kthreadd]
    3     0 [ksoftirqd/0]
    4     0 [kworker/0:0]
    5     0 [kworker/0:0H]
    6     0 [kworker/u2:0]
    7     0 [migration/0]
    8     0 [rcu_bh]
[...]
12518 22996 /usr/lib/gnome-settings-daemon-3.0/gnome-settings-daemon
12626 23540 /usr/bin/nautilus --no-default-window
12305 32188 /usr/bin/Xorg :0 -background none -verbose
12594 164900 /usr/bin/gnome-shell
Useful ps Calls #
ps aux--sort COLUMNSort the output by COLUMN. Replace COLUMN with
pmemfor physical memory ratiopcpufor CPU ratiorssfor resident set size (non-swapped physical memory)ps axo pid,%cpu,rss,vsz,args,wchanShows every process, their PID, CPU usage ratio, memory size (resident and virtual), name, and their syscall.
ps axfo pid,argsShow a process tree.
2.3.3 Process Tree: pstree #Edit source
The command pstree produces a list of processes in
the form of a tree:
tux > pstree
systemd---accounts-daemon---{gdbus}
        |                 |-{gmain}
        |-at-spi-bus-laun---dbus-daemon
        |                 |-{dconf worker}
        |                 |-{gdbus}
        |                 |-{gmain}
        |-at-spi2-registr---{gdbus}
        |-cron
        |-2*[dbus-daemon]
        |-dbus-launch
        |-dconf-service---{gdbus}
        |               |-{gmain}
        |-gconfd-2
        |-gdm---gdm-simple-slav---Xorg
        |     |                 |-gdm-session-wor---gnome-session---gnome-setti+
        |     |                 |                 |               |-gnome-shell+++
        |     |                 |                 |               |-{dconf work+
        |     |                 |                 |               |-{gdbus}
        |     |                 |                 |               |-{gmain}
        |     |                 |                 |-{gdbus}
        |     |                 |                 |-{gmain}
        |     |                 |-{gdbus}
        |     |                 |-{gmain}
        |     |-{gdbus}
        |     |-{gmain}
[...]
The parameter -p adds the process ID to a given name.
To have the command lines displayed as well, use the -a
parameter:
2.3.4 Table of Processes: top #Edit source
The command top (an abbreviation of “table of
processes”) displays a list of processes that is refreshed every
two seconds. To terminate the program, press Q. The
parameter -n 1 terminates the program after a single
display of the process list. The following is an example output of the
command top -n 1:
tux > top -n 1
Tasks: 128 total,   1 running, 127 sleeping,   0 stopped,   0 zombie
%Cpu(s):  2.4 us,  1.2 sy,  0.0 ni, 96.3 id,  0.1 wa,  0.0 hi,  0.0 si,  0.0 st
KiB Mem:   1535508 total,   699948 used,   835560 free,      880 buffers
KiB Swap:  1541116 total,        0 used,  1541116 free.   377000 cached Mem

  PID USER      PR  NI    VIRT    RES    SHR S  %CPU  %MEM     TIME+ COMMAND
    1 root      20   0  116292   4660   2028 S 0.000 0.303   0:04.45 systemd
    2 root      20   0       0      0      0 S 0.000 0.000   0:00.00 kthreadd
    3 root      20   0       0      0      0 S 0.000 0.000   0:00.07 ksoftirqd+
    5 root       0 -20       0      0      0 S 0.000 0.000   0:00.00 kworker/0+
    6 root      20   0       0      0      0 S 0.000 0.000   0:00.00 kworker/u+
    7 root      rt   0       0      0      0 S 0.000 0.000   0:00.00 migration+
    8 root      20   0       0      0      0 S 0.000 0.000   0:00.00 rcu_bh
    9 root      20   0       0      0      0 S 0.000 0.000   0:00.24 rcu_sched
   10 root      rt   0       0      0      0 S 0.000 0.000   0:00.01 watchdog/0
   11 root       0 -20       0      0      0 S 0.000 0.000   0:00.00 khelper
   12 root      20   0       0      0      0 S 0.000 0.000   0:00.00 kdevtmpfs
   13 root       0 -20       0      0      0 S 0.000 0.000   0:00.00 netns
   14 root       0 -20       0      0      0 S 0.000 0.000   0:00.00 writeback
   15 root       0 -20       0      0      0 S 0.000 0.000   0:00.00 kintegrit+
   16 root       0 -20       0      0      0 S 0.000 0.000   0:00.00 bioset
   17 root       0 -20       0      0      0 S 0.000 0.000   0:00.00 crypto
   18 root       0 -20       0      0      0 S 0.000 0.000   0:00.00 kblockd
By default the output is sorted by CPU usage (column , shortcut Shift–P). Use the following key combinations to change the sort field:
| Shift–M: Resident Memory () |
| Shift–N: Process ID () |
| Shift–T: Time () |
To use any other field for sorting, press F and select a field from the list. To toggle the sort order, Use Shift–R.
The parameter -U UID
monitors only the processes associated with a particular user. Replace
UID with the user ID of the user. Use
top -U $(id -u) to show processes of the current user
2.3.5 A top-like I/O Monitor: iotop #Edit source
The iotop utility displays a table of I/O usage by
processes or threads.
Note: Installing iotop
iotop is not installed by default. You need to
install it manually with zypper in iotop as
root.
iotop displays columns for the I/O bandwidth read and
written by each process during the sampling period. It also displays the
percentage of time the process spent while swapping in and while waiting
on I/O. For each process, its I/O priority (class/level) is shown. In
addition, the total I/O bandwidth read and written during the sampling
period is displayed at the top of the interface.
The ← and → keys change the sorting.
R reverses the sort order.
O toggles between showing all processes and threads (default view) and showing only those doing I/O. (This function is similar to adding
--onlyon command line.)P toggles between showing threads (default view) and processes. (This function is similar to
--only.)A toggles between showing the current I/O bandwidth (default view) and accumulated I/O operations since
iotopwas started. (This function is similar to--accumulated.)I lets you change the priority of a thread or a process's threads.
Q quits
iotop.Pressing any other key will force a refresh.
Following is an example output of the command iotop
--only, while find and
emacs are running:
root # iotop --only
Total DISK READ: 50.61 K/s | Total DISK WRITE: 11.68 K/s
  TID  PRIO  USER     DISK READ  DISK WRITE  SWAPIN     IO>    COMMAND
 3416 be/4 tux         50.61 K/s    0.00 B/s  0.00 %  4.05 % find /
  275 be/3 root        0.00 B/s    3.89 K/s  0.00 %  2.34 % [jbd2/sda2-8]
 5055 be/4 tux          0.00 B/s    3.89 K/s  0.00 %  0.04 % emacs
iotop can be also used in a batch mode
(-b) and its output stored in a file for later
analysis. For a complete set of options, see the manual page
(man 8 iotop).
2.3.6 Modify a process's niceness: nice and renice #Edit source
The kernel determines which processes require more CPU time than others
by the process's nice level, also called niceness. The higher the
“nice” level of a process is, the less CPU time it will
take from other processes. Nice levels range from -20 (the least
“nice” level) to 19. Negative values can only be set by
root.
Adjusting the niceness level is useful when running a non time-critical process that lasts long and uses large amounts of CPU time. For example, compiling a kernel on a system that also performs other tasks. Making such a process “nicer”, ensures that the other tasks, for example a Web server, will have a higher priority.
Calling nice without any parameters prints the
current niceness:
tux > nice
0
Running nice COMMAND
increments the current nice level for the given command by 10. Using
nice -n
LEVEL
COMMAND lets you specify a new niceness
relative to the current one.
To change the niceness of a running process, use
renice PRIORITY -p
PROCESS_ID, for example:
tux > renice +5 3266
To renice all processes owned by a specific user, use the option
-u USER.
Process groups are reniced by the option -g PROCESS_GROUP_ID.
2.4 Memory #Edit source
2.4.1 Memory Usage: free #Edit source
The utility free examines RAM and swap usage. Details
of both free and used memory and swap areas are shown:
tux > free
             total       used       free     shared    buffers     cached
Mem:      32900500   32703448     197052          0     255668    5787364
-/+ buffers/cache:   26660416    6240084
Swap:      2046972     304680    1742292
The options -b, -k,
-m, -g show the output in bytes, KB,
MB, or GB, respectively. The parameter -s delay ensures
that the display is refreshed every DELAY
seconds. For example, free -s 1.5 produces an update
every 1.5 seconds.
2.4.2 Detailed Memory Usage: /proc/meminfo #Edit source
Use /proc/meminfo to get more detailed information
on memory usage than with free. Actually
free uses some data from this file. See an
example output from a 64-bit system below. Note that it slightly differs
on 32-bit systems because of different memory management:
MemTotal:        1942636 kB
MemFree:         1294352 kB
MemAvailable:    1458744 kB
Buffers:             876 kB
Cached:           278476 kB
SwapCached:            0 kB
Active:           368328 kB
Inactive:         199368 kB
Active(anon):     288968 kB
Inactive(anon):    10568 kB
Active(file):      79360 kB
Inactive(file):   188800 kB
Unevictable:          80 kB
Mlocked:              80 kB
SwapTotal:       2103292 kB
SwapFree:        2103292 kB
Dirty:                44 kB
Writeback:             0 kB
AnonPages:        288592 kB
Mapped:            70444 kB
Shmem:             11192 kB
Slab:              40916 kB
SReclaimable:      17712 kB
SUnreclaim:        23204 kB
KernelStack:        2000 kB
PageTables:        10996 kB
NFS_Unstable:          0 kB
Bounce:                0 kB
WritebackTmp:          0 kB
CommitLimit:     3074608 kB
Committed_AS:    1407208 kB
VmallocTotal:   34359738367 kB
VmallocUsed:      145996 kB
VmallocChunk:   34359588844 kB
HardwareCorrupted:     0 kB
AnonHugePages:     86016 kB
HugePages_Total:       0
HugePages_Free:        0
HugePages_Rsvd:        0
HugePages_Surp:        0
Hugepagesize:       2048 kB
DirectMap4k:       79744 kB
DirectMap2M:     2017280 kB
These entries stand for the following:
Total amount of RAM.
Amount of unused RAM.
Estimate of how much memory is available for starting new applications without swapping.
File buffer cache in RAM containing file system metadata.
Page cache in RAM. This excludes buffer cache and swap cache, but includes memory.
Page cache for swapped-out memory.
- , ,
Recently used memory that will not be reclaimed unless necessary or on explicit request. is the sum of and :
tracks swap-backed memory. This includes private and shared anonymous mappings and private file pages after copy-on-write.
tracks other file system backed memory.
- , ,
Less recently used memory that will usually be reclaimed first. is the sum of and :
tracks swap backed memory. This includes private and shared anonymous mappings and private file pages after copy-on-write.
tracks other file system backed memory.
Amount of memory that cannot be reclaimed (for example, because it is or used as a RAM disk).
Amount of memory that is backed by the
mlocksystem call.mlockallows processes to define which part of physical RAM their virtual memory should be mapped to. However,mlockdoes not guarantee this placement.Amount of swap space.
Amount of unused swap space.
Amount of memory waiting to be written to disk, because it contains changes compared to the backing storage. Dirty data can be explicitly synchronized either by the application or by the kernel after a short delay. A large amount of dirty data may take considerable time to write to disk resulting in stalls. The total amount of dirty data that can exist at any time can be controlled with the
sysctlparametersvm.dirty_ratioorvm.dirty_bytes(refer to Section 14.1.5, “Writeback” for more details).Amount of memory that is currently being written to disk.
Memory claimed with the
mmapsystem call.Memory shared between groups of processes, such as IPC data,
tmpfsdata, and shared anonymous memory.Memory allocation for internal data structures of the kernel.
Slab section that can be reclaimed, such as caches (inode, dentry, etc.).
Slab section that cannot be reclaimed.
Amount of kernel space memory used by applications (through system calls).
Amount of memory dedicated to page tables of all processes.
NFS pages that have already been sent to the server, but are not yet committed there.
Memory used for bounce buffers of block devices.
Memory used by FUSE for temporary writeback buffers.
Amount of memory available to the system based on the overcommit ratio setting. This is only enforced if strict overcommit accounting is enabled.
An approximation of the total amount of memory (RAM and swap) that the current workload would need in the worst case.
Amount of allocated kernel virtual address space.
Amount of used kernel virtual address space.
The largest contiguous block of available kernel virtual address space.
Amount of failed memory (can only be detected when using ECC RAM).
Anonymous hugepages that are mapped into user space page tables. These are allocated transparently for processes without being specifically requested, therefore they are also known as transparent hugepages (THP).
Number of preallocated hugepages for use by
SHM_HUGETLBandMAP_HUGETLBor through thehugetlbfsfile system, as defined in/proc/sys/vm/nr_hugepages.Number of hugepages available.
Number of hugepages that are committed.
Number of hugepages available beyond (“surplus”), as defined in
/proc/sys/vm/nr_overcommit_hugepages.Size of a hugepage—on AMD64/Intel 64 the default is 2048 KB.
- etc.
Amount of kernel memory that is mapped to pages with a given size (in the example: 4 kB).
2.4.3 Process Memory Usage: smaps #Edit source
Exactly determining how much memory a certain process is consuming is
not possible with standard tools like top or
ps. Use the smaps subsystem, introduced in kernel
2.6.14, if you need exact data. It can be found at
/proc/PID/smaps and
shows you the number of clean and dirty memory pages the process with
the ID PID is using at that time. It
differentiates between shared and private memory, so you can see
how much memory the process is using without including memory shared
with other processes. For more information see
/usr/src/linux/Documentation/filesystems/proc.txt
(requires the package
kernel-source to be
installed).
smaps is expensive to read. Therefore it is not recommended to monitor it regularly, but only when closely monitoring a certain process.
2.4.4 numaTOP #Edit source
numaTOP is a tool for NUMA (Non-uniform Memory Access) systems. The tool helps to identify NUMA-related performance bottlenecks by providing real-time analysis of a NUMA system.
Generally speaking, numaTOP allows you to identify and investigate processes and threads with poor locality (that is poor ratio of local versus remote memory usage) by analyzing the number of Remote Memory Accesses (RMA), the number of Local Memory Accesses (LMA), and the RMA/LMA ratio.
numaTOP is supported on PowerPC and the following Intel Xeon processors: 5500-series, 6500/7500-series, 5600-series, E7-x8xx-series, and E5-16xx/24xx/26xx/46xx-series.
numaTOP is available in the official software repositories, and
you can install the tool using the sudo zypper in
numatop command. To launch numaTOP, run the
numatop command. To get an overview of
numaTOP functionality and usage, use the man
numatop command.
2.5 Networking #Edit source
Tip: Traffic Shaping
In case the network bandwidth is lower than expected, you should first check if any traffic shaping rules are active for your network segment.
2.5.1 Basic Network Diagnostics: ip #Edit source
ip is a powerful tool to set up and control network
interfaces. You can also use it to quickly view basic statistics about
network interfaces of the system. For example, whether the interface is
up or how many errors, dropped packets, or packet collisions there are.
If you run ip with no additional parameter, it
displays a help output. To list all network interfaces, enter
ip addr show (or abbreviated as ip
a). ip addr show up lists only running
network interfaces. ip -s link show
DEVICE lists statistics for the specified
interface only:
root # ip -s link show br0
6: br0: <BROADCAST,MULTICAST,UP,LOWER_UP> mtu 1500 qdisc noqueue state UP mode DEFAULT
    link/ether 00:19:d1:72:d4:30 brd ff:ff:ff:ff:ff:ff
    RX: bytes  packets  errors  dropped overrun mcast
    6346104756 9265517  0       10860   0       0
    TX: bytes  packets  errors  dropped carrier collsns
    3996204683 3655523  0       0       0       0
ip can also show interfaces
(link), routing tables (route), and
much more—refer to man 8 ip for details.
root # ip route
default via 192.168.2.1 dev eth1
192.168.2.0/24 dev eth0  proto kernel  scope link  src 192.168.2.100
192.168.2.0/24 dev eth1  proto kernel  scope link  src 192.168.2.101
192.168.2.0/24 dev eth2  proto kernel  scope link  src 192.168.2.102
root # ip link
1: lo: <LOOPBACK,UP,LOWER_UP> mtu 65536 qdisc noqueue state UNKNOWN mode DEFAULT group default
link/loopback 00:00:00:00:00:00 brd 00:00:00:00:00:00
2: eth0: <BROADCAST,MULTICAST,UP,LOWER_UP> mtu 1500 qdisc pfifo_fast state UP mode DEFAULT group default qlen 1000
link/ether 52:54:00:44:30:51 brd ff:ff:ff:ff:ff:ff
3: eth1: <BROADCAST,MULTICAST,UP,LOWER_UP> mtu 1500 qdisc pfifo_fast state UP mode DEFAULT group default qlen 1000
link/ether 52:54:00:a3:c1:fb brd ff:ff:ff:ff:ff:ff
4: eth2: <BROADCAST,MULTICAST,UP,LOWER_UP> mtu 1500 qdisc pfifo_fast state UP mode DEFAULT group default qlen 1000
link/ether 52:54:00:32:a4:09 brd ff:ff:ff:ff:ff:ff2.5.2
Show the Network Usage of Processes: nethogs
#Edit source
In some cases, for example if the network traffic suddenly becomes very
high, it is desirable to quickly find out which application(s) is/are
causing the traffic. nethogs, a tool with a design
similar to top, shows incoming and outgoing traffic for
all relevant processes:
PID   USER  PROGRAM                                DEV   SENT   RECEIVED
27145 root   zypper                                eth0  5.719  391.749 KB/sec
?     root   ..0:113:80c0:8080:10:160:0:100:30015        0.102    2.326 KB/sec
26635 tux    /usr/lib64/firefox/firefox            eth0  0.026    0.026 KB/sec
?     root   ..0:113:80c0:8080:10:160:0:100:30045        0.000    0.021 KB/sec
?     root   ..0:113:80c0:8080:10:160:0:100:30045        0.000    0.018 KB/sec
?     root   ..0:113:80c0:8080:10:160:0:100:30015        0.000    0.018 KB/sec
?     root   ..0:113:80c0:8080:10:160:0:100:30045        0.000    0.017 KB/sec
?     root   ..0:113:80c0:8080:10:160:0:100:30045        0.000    0.017 KB/sec
?     root   ..0:113:80c0:8080:10:160:0:100:30045        0.069    0.000 KB/sec
?     root   unknown TCP                                 0.000    0.000 KB/sec

TOTAL                                                  5.916  394.192 KB/sec
Like in top, nethogs features
interactive commands:
| M: cycle between display modes (kb/s, kb, b, mb) |
| R: sort by |
| S: sort by |
| Q: quit |
2.5.3 Ethernet Cards in Detail: ethtool #Edit source
ethtool can display and change detailed aspects of
your Ethernet network device. By default it prints the current setting
of the specified device.
root # ethtool eth0
Settings for eth0:
 Supported ports: [ TP ]
 Supported link modes:   10baseT/Half 10baseT/Full
                         100baseT/Half 100baseT/Full
                         1000baseT/Full
 Supports auto-negotiation: Yes
 Advertised link modes:  10baseT/Half 10baseT/Full
                         100baseT/Half 100baseT/Full
                         1000baseT/Full
 Advertised pause frame use: No
[...]
 Link detected: yes
The following table shows ethtool options that you
can use to query the device for specific information:
Table 2.1: List of Query Options of ethtool #
|
|
it queries the device for |
|---|---|
|
-a |
pause parameter information |
|
-c |
interrupt coalescing information |
|
-g |
Rx/Tx (receive/transmit) ring parameter information |
|
-i |
associated driver information |
|
-k |
offload information |
|
-S |
NIC and driver-specific statistics |
2.5.4 Show the Network Status: ss #Edit source
ss is a tool to dump socket statistics and replaces
the netstat command. To list all
connections use ss without parameters:
root # ss
Netid  State      Recv-Q Send-Q   Local Address:Port       Peer Address:Port
u_str  ESTAB      0      0                    * 14082                 * 14083
u_str  ESTAB      0      0                    * 18582                 * 18583
u_str  ESTAB      0      0                    * 19449                 * 19450
u_str  ESTAB      0      0      @/tmp/dbus-gmUUwXABPV 18784           * 18783
u_str  ESTAB      0      0      /var/run/dbus/system_bus_socket 19383 * 19382
u_str  ESTAB      0      0      @/tmp/dbus-gmUUwXABPV 18617           * 18616
u_str  ESTAB      0      0      @/tmp/dbus-58TPPDv8qv 19352           * 19351
u_str  ESTAB      0      0                    * 17658                 * 17657
u_str  ESTAB      0      0                    * 17693                 * 17694
[..]
To show all network ports currently open, use the following command:
root # ss -l
Netid  State      Recv-Q Send-Q      Local Address:Port  Peer Address:Port
nl     UNCONN     0      0                 rtnl:4195117                  *
nl     UNCONN     0      0       rtnl:wickedd-auto4/811                  *
nl     UNCONN     0      0       rtnl:wickedd-dhcp4/813                  *
nl     UNCONN     0      0                 rtnl:4195121                  *
nl     UNCONN     0      0                 rtnl:4195115                  *
nl     UNCONN     0      0       rtnl:wickedd-dhcp6/814                  *
nl     UNCONN     0      0                  rtnl:kernel                  *
nl     UNCONN     0      0             rtnl:wickedd/817                  *
nl     UNCONN     0      0                 rtnl:4195118                  *
nl     UNCONN     0      0                rtnl:nscd/706                  *
nl     UNCONN     4352   0              tcpdiag:ss/2381                  *
[...]
When displaying network connections, you can specify the socket type to
display: TCP (-t) or UDP (-u) for
example. The -p option shows the PID and name of the
program to which each socket belongs.
The following example lists all TCP connections and the programs using
these connections. The -a option make sure all
established connections (listening and non-listening) are shown. The
-p option shows the PID and name of the program to
which each socket belongs.
root # ss -t -a -p
State    Recv-Q Send-Q  Local Address:Port   Peer Address:Port
LISTEN   0      128                  *:ssh                 *:*  users:(("sshd",1551,3))
LISTEN   0      100         127.0.0.1:smtp                 *:*  users:(("master",1704,13))
ESTAB    0      132      10.120.65.198:ssh  10.120.4.150:55715  users:(("sshd",2103,5))
LISTEN   0      128                 :::ssh                :::*  users:(("sshd",1551,4))
LISTEN   0      100               ::1:smtp                :::*  users:(("master",1704,14))
2.6 The /proc File System #Edit source
The /proc file system is a pseudo file system in
which the kernel reserves important information in the form of virtual
files. For example, display the CPU type with this command:
tux > cat /proc/cpuinfo
processor       : 0
vendor_id       : GenuineIntel
cpu family      : 6
model           : 30
model name      : Intel(R) Core(TM) i5 CPU         750  @ 2.67GHz
stepping        : 5
microcode       : 0x6
cpu MHz         : 1197.000
cache size      : 8192 KB
physical id     : 0
siblings        : 4
core id         : 0
cpu cores       : 4
apicid          : 0
initial apicid  : 0
fpu             : yes
fpu_exception   : yes
cpuid level     : 11
wp              : yes
flags           : fpu vme de pse tsc msr pae mce cx8 apic sep mtrr pge mca cmov pat pse36 clflush dts acpi mmx fxsr sse sse2 ss ht tm pbe syscall nx rdtscp lm constant_tsc arch_perfmon pebs bts rep_good nopl xtopology nonstop_tsc aperfmperf pni dtes64 monitor ds_cpl vmx smx est tm2 ssse3 cx16 xtpr pdcm sse4_1 sse4_2 popcnt lahf_lm ida dtherm tpr_shadow vnmi flexpriority ept vpid
bogomips        : 5333.85
clflush size    : 64
cache_alignment : 64
address sizes   : 36 bits physical, 48 bits virtual
power management:
[...]
Tip: Detailed Processor Information
Detailed information about the processor on the AMD64/Intel 64 architecture is
also available by running x86info.
Query the allocation and use of interrupts with the following command:
tux > cat /proc/interrupts
           CPU0       CPU1       CPU2       CPU3
  0:        121          0          0          0   IO-APIC-edge      timer
  8:          0          0          0          1   IO-APIC-edge      rtc0
  9:          0          0          0          0   IO-APIC-fasteoi   acpi
 16:          0      11933          0          0   IO-APIC-fasteoi   ehci_hcd:+
 18:          0          0          0          0   IO-APIC-fasteoi   i801_smbus
 19:          0     117978          0          0   IO-APIC-fasteoi   ata_piix,+
 22:          0          0    3275185          0   IO-APIC-fasteoi   enp5s1
 23:     417927          0          0          0   IO-APIC-fasteoi   ehci_hcd:+
 40:    2727916          0          0          0  HPET_MSI-edge      hpet2
 41:          0    2749134          0          0  HPET_MSI-edge      hpet3
 42:          0          0    2759148          0  HPET_MSI-edge      hpet4
 43:          0          0          0    2678206  HPET_MSI-edge      hpet5
 45:          0          0          0          0   PCI-MSI-edge      aerdrv, P+
 46:          0          0          0          0   PCI-MSI-edge      PCIe PME,+
 47:          0          0          0          0   PCI-MSI-edge      PCIe PME,+
 48:          0          0          0          0   PCI-MSI-edge      PCIe PME,+
 49:          0          0          0        387   PCI-MSI-edge      snd_hda_i+
 50:     933117          0          0          0   PCI-MSI-edge      nvidia
NMI:       2102       2023       2031       1920   Non-maskable interrupts
LOC:         92         71         57         41   Local timer interrupts
SPU:          0          0          0          0   Spurious interrupts
PMI:       2102       2023       2031       1920   Performance monitoring int+
IWI:      47331      45725      52464      46775   IRQ work interrupts
RTR:          2          0          0          0   APIC ICR read retries
RES:     472911     396463     339792     323820   Rescheduling interrupts
CAL:      48389      47345      54113      50478   Function call interrupts
TLB:      28410      26804      24389      26157   TLB shootdowns
TRM:          0          0          0          0   Thermal event interrupts
THR:          0          0          0          0   Threshold APIC interrupts
MCE:          0          0          0          0   Machine check exceptions
MCP:         40         40         40         40   Machine check polls
ERR:          0
MIS:          0
The address assignment of executables and libraries is contained in the
maps file:
tux > cat /proc/self/maps
08048000-0804c000 r-xp 00000000 03:03 17753      /bin/cat
0804c000-0804d000 rw-p 00004000 03:03 17753      /bin/cat
0804d000-0806e000 rw-p 0804d000 00:00 0          [heap]
b7d27000-b7d5a000 r--p 00000000 03:03 11867      /usr/lib/locale/en_GB.utf8/
b7d5a000-b7e32000 r--p 00000000 03:03 11868      /usr/lib/locale/en_GB.utf8/
b7e32000-b7e33000 rw-p b7e32000 00:00 0
b7e33000-b7f45000 r-xp 00000000 03:03 8837       /lib/libc-2.3.6.so
b7f45000-b7f46000 r--p 00112000 03:03 8837       /lib/libc-2.3.6.so
b7f46000-b7f48000 rw-p 00113000 03:03 8837       /lib/libc-2.3.6.so
b7f48000-b7f4c000 rw-p b7f48000 00:00 0
b7f52000-b7f53000 r--p 00000000 03:03 11842      /usr/lib/locale/en_GB.utf8/
[...]
b7f5b000-b7f61000 r--s 00000000 03:03 9109       /usr/lib/gconv/gconv-module
b7f61000-b7f62000 r--p 00000000 03:03 9720       /usr/lib/locale/en_GB.utf8/
b7f62000-b7f76000 r-xp 00000000 03:03 8828       /lib/ld-2.3.6.so
b7f76000-b7f78000 rw-p 00013000 03:03 8828       /lib/ld-2.3.6.so
bfd61000-bfd76000 rw-p bfd61000 00:00 0          [stack]
ffffe000-fffff000 ---p 00000000 00:00 0          [vdso]
A lot more information can be obtained from the /proc file system. Some important files and their contents are:
/proc/devicesAvailable devices
/proc/modulesKernel modules loaded
/proc/cmdlineKernel command line
/proc/meminfoDetailed information about memory usage
/proc/config.gzgzip-compressed configuration file of the kernel currently running- /proc/PID/
Find information about processes currently running in the
/proc/NNN directories, where NNN is the process ID (PID) of the relevant process. Every process can find its own characteristics in/proc/self/.
Further information is available in the text file
/usr/src/linux/Documentation/filesystems/proc.txt
(this file is available when the package
kernel-source is installed).
2.6.1 procinfo #Edit source
Important information from the /proc file system is
summarized by the command procinfo:
tux > procinfo
Linux 3.11.10-17-desktop (geeko@buildhost) (gcc 4.8.1 20130909) #1 4CPU [jupiter.example.com]

Memory:      Total        Used        Free      Shared     Buffers      Cached
Mem:       8181908     8000632      181276           0       85472     2850872
Swap:     10481660        1576    10480084

Bootup: Mon Jul 28 09:54:13 2014    Load average: 1.61 0.85 0.74 2/904 25949

user  :       1:54:41.84  12.7%  page in :    2107312  disk 1:    52212r   20199w
nice  :       0:00:00.46   0.0%  page out:    1714461  disk 2:    19387r   10928w
system:       0:25:38.00   2.8%  page act:     466673  disk 3:      548r      10w
IOwait:       0:04:16.45   0.4%  page dea:     272297
hw irq:       0:00:00.42   0.0%  page flt:  105754526
sw irq:       0:01:26.48   0.1%  swap in :          0
idle  :      12:14:43.65  81.5%  swap out:        394
guest :       0:02:18.59   0.2%
uptime:       3:45:22.24         context :   99809844

irq  0:       121 timer                 irq 41:   3238224 hpet3
irq  8:         1 rtc0                  irq 42:   3251898 hpet4
irq  9:         0 acpi                  irq 43:   3156368 hpet5
irq 16:     14589 ehci_hcd:usb1         irq 45:         0 aerdrv, PCIe PME
irq 18:         0 i801_smbus            irq 46:         0 PCIe PME, pciehp
irq 19:    124861 ata_piix, ata_piix, f irq 47:         0 PCIe PME, pciehp
irq 22:   3742817 enp5s1                irq 48:         0 PCIe PME, pciehp
irq 23:    479248 ehci_hcd:usb2         irq 49:       387 snd_hda_intel
irq 40:   3216894 hpet2                 irq 50:   1088673 nvidia
To see all the information, use the parameter -a. The
parameter -nN produces updates of the information every
N seconds. In this case, terminate the
program by pressing Q.
By default, the cumulative values are displayed. The parameter
-d produces the differential values. procinfo
-dn5 displays the values that have changed in the last five
seconds:
2.6.2 System Control Parameters: /proc/sys/ #Edit source
System control parameters are used to modify the Linux kernel parameters
at runtime. They reside in /proc/sys/ and can be
viewed and modified with the sysctl command. To list
all parameters, run sysctl -a. A
single parameter can be listed with sysctl
PARAMETER_NAME.
Parameters are grouped into categories and can be listed with
sysctl CATEGORY or by
listing the contents of the respective directories. The most important
categories are listed below. The links to further readings require the
installation of the package
kernel-source.
sysctl dev(/proc/sys/dev/)Device-specific information.
sysctl fs(/proc/sys/fs/)Used file handles, quotas, and other file system-oriented parameters. For details see
/usr/src/linux/Documentation/sysctl/fs.txt.sysctl kernel(/proc/sys/kernel/)Information about the task scheduler, system shared memory, and other kernel-related parameters. For details see
/usr/src/linux/Documentation/sysctl/kernel.txtsysctl net(/proc/sys/net/)Information about network bridges, and general network parameters (mainly the
ipv4/subdirectory). For details see/usr/src/linux/Documentation/sysctl/net.txtsysctl vm(/proc/sys/vm/)Entries in this path relate to information about the virtual memory, swapping, and caching. For details see
/usr/src/linux/Documentation/sysctl/vm.txt
To set or change a parameter for the current session, use the command
sysctl -w
PARAMETER=VALUE.
To permanently change a setting, add a line
PARAMETER=VALUE to
/etc/sysctl.conf.
2.7 Hardware Information #Edit source
2.7.1 PCI Resources: lspci #Edit source
Note: Accessing PCI configuration.
Most operating systems require root user privileges to grant access to the computer's PCI configuration.
The command lspci lists the PCI resources:
root # lspci
00:00.0 Host bridge: Intel Corporation 82845G/GL[Brookdale-G]/GE/PE \
    DRAM Controller/Host-Hub Interface (rev 01)
00:01.0 PCI bridge: Intel Corporation 82845G/GL[Brookdale-G]/GE/PE \
    Host-to-AGP Bridge (rev 01)
00:1d.0 USB Controller: Intel Corporation 82801DB/DBL/DBM \
    (ICH4/ICH4-L/ICH4-M) USB UHCI Controller #1 (rev 01)
00:1d.1 USB Controller: Intel Corporation 82801DB/DBL/DBM \
    (ICH4/ICH4-L/ICH4-M) USB UHCI Controller #2 (rev 01)
00:1d.2 USB Controller: Intel Corporation 82801DB/DBL/DBM \
    (ICH4/ICH4-L/ICH4-M) USB UHCI Controller #3 (rev 01)
00:1d.7 USB Controller: Intel Corporation 82801DB/DBM \
    (ICH4/ICH4-M) USB2 EHCI Controller (rev 01)
00:1e.0 PCI bridge: Intel Corporation 82801 PCI Bridge (rev 81)
00:1f.0 ISA bridge: Intel Corporation 82801DB/DBL (ICH4/ICH4-L) \
    LPC Interface Bridge (rev 01)
00:1f.1 IDE interface: Intel Corporation 82801DB (ICH4) IDE \
    Controller (rev 01)
00:1f.3 SMBus: Intel Corporation 82801DB/DBL/DBM (ICH4/ICH4-L/ICH4-M) \
    SMBus Controller (rev 01)
00:1f.5 Multimedia audio controller: Intel Corporation 82801DB/DBL/DBM \
    (ICH4/ICH4-L/ICH4-M) AC'97 Audio Controller (rev 01)
01:00.0 VGA compatible controller: Matrox Graphics, Inc. G400/G450 (rev 85)
02:08.0 Ethernet controller: Intel Corporation 82801DB PRO/100 VE (LOM) \
    Ethernet Controller (rev 81)
Using -v results in a more detailed listing:
root # lspci -v
[...]
00:03.0 Ethernet controller: Intel Corporation 82540EM Gigabit Ethernet \
Controller (rev 02)
  Subsystem: Intel Corporation PRO/1000 MT Desktop Adapter
  Flags: bus master, 66MHz, medium devsel, latency 64, IRQ 19
  Memory at f0000000 (32-bit, non-prefetchable) [size=128K]
  I/O ports at d010 [size=8]
  Capabilities: [dc] Power Management version 2
  Capabilities: [e4] PCI-X non-bridge device
  Kernel driver in use: e1000
  Kernel modules: e1000
Information about device name resolution is obtained from the file
/usr/share/pci.ids. PCI IDs not listed in this file
are marked “Unknown device.”
The parameter -vv produces all the information that
could be queried by the program. To view the pure numeric values, use
the parameter -n.
2.7.2 USB Devices: lsusb #Edit source
The command lsusb lists all USB devices. With the
option -v, print a more detailed list. The detailed
information is read from the directory
/proc/bus/usb/. The following is the output of
lsusb with these USB devices attached: hub, memory
stick, hard disk and mouse.
root # lsusb
Bus 004 Device 007: ID 0ea0:2168 Ours Technology, Inc. Transcend JetFlash \
    2.0 / Astone USB Drive
Bus 004 Device 006: ID 04b4:6830 Cypress Semiconductor Corp. USB-2.0 IDE \
    Adapter
Bus 004 Device 005: ID 05e3:0605 Genesys Logic, Inc.
Bus 004 Device 001: ID 0000:0000
Bus 003 Device 001: ID 0000:0000
Bus 002 Device 001: ID 0000:0000
Bus 001 Device 005: ID 046d:c012 Logitech, Inc. Optical Mouse
Bus 001 Device 001: ID 0000:0000
2.7.3
Monitoring and Tuning the Thermal Subsystem: tmon
#Edit source
tmon is a tool to help visualize, tune, and test the
complex thermal subsystem. When started without parameters,
tmon runs in monitoring mode:
┌──────THERMAL ZONES(SENSORS)──────────────────────────────┐
│Thermal Zones:                 acpitz00                   │
│Trip Points:                   PC                         │
└──────────────────────────────────────────────────────────┘
┌─────────── COOLING DEVICES ──────────────────────────────┐
│ID  Cooling Dev   Cur    Max   Thermal Zone Binding       │
│00    Processor     0      3   ││││││││││││               │
│01    Processor     0      3   ││││││││││││               │
│02    Processor     0      3   ││││││││││││               │
│03    Processor     0      3   ││││││││││││               │
│04 intel_powerc    -1     50   ││││││││││││               │
└──────────────────────────────────────────────────────────┘
┌──────────────────────────────────────────────────────────┐
│                         10        20        30        40 │
│acpitz 0:[  8][>>>>>>>>>P9                    C31         │
└──────────────────────────────────────────────────────────┘
┌────────────────── CONTROLS ──────────────────────────────┐
│PID gain: kp=0.36 ki=5.00 kd=0.19 Output 0.00             │
│Target Temp: 65.0C, Zone: 0, Control Device: None         │
└──────────────────────────────────────────────────────────┘

Ctrl-c - Quit   TAB - Tuning
For detailed information on how to interpret the data, how to log thermal
data and how to use tmon to test and tune cooling
devices and sensors, refer to the man page: man 8
tmon. The package tmon is not installed by
default.
2.7.4 MCELog: Machine Check Exceptions (MCE) #Edit source
The mcelog package logs and
parses/translates Machine Check Exceptions (MCE) on hardware errors, including
I/O, CPU, and memory errors. In addition, mcelog handles predictive bad page
offlining and automatic core offlining when cache errors happen.
Formerly this was managed by a cron job executed hourly. Now hardware
errors are immediately processed by an mcelog daemon.
Note: Support for AMD Scalable MCA
openSUSE Leap 15.0 and higher support AMD's Scalable Machine Check Architecture (Scalable MCA). Scalable MCA improves hardware error reporting in AMD Zen processors. It expands information logged in MCA banks for improved error handling and better diagnosability.
mcelog captures MCA messages
(rasdaemon and
dmesg also capture MCA messages).
See section 3.1, Machine Check Architecture of
Processor Programming Reference (PPR) for AMD Family
17h Model 01h, Revision B1 Processors for detailed
information,
http://developer.amd.com/wordpress/media/2017/11/54945_PPR_Family_17h_Models_00h-0Fh.pdf.
mcelog is configured in /etc/mcelog/mcelog.conf.
Configuration options are documented in
man mcelog, and at
http://mcelog.org/. The following example shows
only changes to the default file:
daemon = yes
filter = yes
filter-memory-errors = yes
no-syslog = yes
logfile = /var/log/mcelog
run-credentials-user = root
run-credentials-group = nobody
client-group = root
socket-path = /var/run/mcelog-client
The mcelog service is not enabled by default. The service can either be enabled and started via the YaST system services editor, or via command line:
root #systemctl enable mcelogroot #systemctl start mcelog
2.7.5 x86_64: dmidecode: DMI Table Decoder #Edit source
dmidecode shows the machine's DMI table containing
information such as serial numbers and BIOS revisions of the hardware.
root # dmidecode
# dmidecode 2.12
SMBIOS 2.5 present.
27 structures occupying 1298 bytes.
Table at 0x000EB250.

Handle 0x0000, DMI type 4, 35 bytes
Processor Information
        Socket Designation: J1PR
        Type: Central Processor
        Family: Other
        Manufacturer: Intel(R) Corporation
        ID: E5 06 01 00 FF FB EB BF
        Version: Intel(R) Core(TM) i5 CPU         750  @ 2.67GHz
        Voltage: 1.1 V
        External Clock: 133 MHz
        Max Speed: 4000 MHz
        Current Speed: 2667 MHz
        Status: Populated, Enabled
        Upgrade: Other
        L1 Cache Handle: 0x0004
        L2 Cache Handle: 0x0003
        L3 Cache Handle: 0x0001
        Serial Number: Not Specified
        Asset Tag: Not Specified
        Part Number: Not Specified
[..]
2.8 Files and File Systems #Edit source
2.8.1 Determine the File Type: file #Edit source
The command file determines the type of a file or a
list of files by checking /usr/share/misc/magic.
tux > file /usr/bin/file
/usr/bin/file: ELF 64-bit LSB executable, x86-64, version 1 (SYSV), \
    for GNU/Linux 2.6.4, dynamically linked (uses shared libs), stripped
The parameter -f LIST
specifies a file with a list of file names to examine. The
-z allows file to look inside
compressed files:
tux >file /usr/share/man/man1/file.1.gz /usr/share/man/man1/file.1.gz: gzip compressed data, from Unix, max compressiontux >file -z /usr/share/man/man1/file.1.gz /usr/share/man/man1/file.1.gz: troff or preprocessor input text \ (gzip compressed data, from Unix, max compression)
The parameter -i outputs a mime type string rather than
the traditional description.
tux > file -i /usr/share/misc/magic
/usr/share/misc/magic: text/plain charset=utf-8
2.8.2 File Systems and Their Usage: mount, df and du #Edit source
The command mount shows which file system (device and
type) is mounted at which mount point:
root # mount
/dev/sda2 on / type ext4 (rw,acl,user_xattr)
proc on /proc type proc (rw)
sysfs on /sys type sysfs (rw)
debugfs on /sys/kernel/debug type debugfs (rw)
devtmpfs on /dev type devtmpfs (rw,mode=0755)
tmpfs on /dev/shm type tmpfs (rw,mode=1777)
devpts on /dev/pts type devpts (rw,mode=0620,gid=5)
/dev/sda3 on /home type ext3 (rw)
securityfs on /sys/kernel/security type securityfs (rw)
fusectl on /sys/fs/fuse/connections type fusectl (rw)
gvfs-fuse-daemon on /home/tux/.gvfs type fuse.gvfs-fuse-daemon \
(rw,nosuid,nodev,user=tux)
Obtain information about total usage of the file systems with the
command df. The parameter -h (or
--human-readable) transforms the output into a form
understandable for common users.
tux > df -h
Filesystem            Size  Used Avail Use% Mounted on
/dev/sda2              20G  5,9G   13G  32% /
devtmpfs              1,6G  236K  1,6G   1% /dev
tmpfs                 1,6G  668K  1,6G   1% /dev/shm
/dev/sda3             208G   40G  159G  20% /home
Display the total size of all the files in a given directory and its
subdirectories with the command du. The parameter
-s suppresses the output of detailed information and
gives only a total for each argument. -h again
transforms the output into a human-readable form:
tux > du -sh /opt
192M    /opt
2.8.3 Additional Information about ELF Binaries #Edit source
Read the content of binaries with the readelf
utility. This even works with ELF files that were built for other
hardware architectures:
tux > readelf --file-header /bin/ls
ELF Header:
  Magic:   7f 45 4c 46 02 01 01 00 00 00 00 00 00 00 00 00
  Class:                             ELF64
  Data:                              2's complement, little endian
  Version:                           1 (current)
  OS/ABI:                            UNIX - System V
  ABI Version:                       0
  Type:                              EXEC (Executable file)
  Machine:                           Advanced Micro Devices X86-64
  Version:                           0x1
  Entry point address:               0x402540
  Start of program headers:          64 (bytes into file)
  Start of section headers:          95720 (bytes into file)
  Flags:                             0x0
  Size of this header:               64 (bytes)
  Size of program headers:           56 (bytes)
  Number of program headers:         9
  Size of section headers:           64 (bytes)
  Number of section headers:         32
  Section header string table index: 31
2.8.4 File Properties: stat #Edit source
The command stat displays file properties:
tux > stat /etc/profile
  File: `/etc/profile'
  Size: 9662            Blocks: 24         IO Block: 4096   regular file
Device: 802h/2050d      Inode: 132349      Links: 1
Access: (0644/-rw-r--r--)  Uid: (    0/    root)   Gid: (    0/    root)
Access: 2009-03-20 07:51:17.000000000 +0100
Modify: 2009-01-08 19:21:14.000000000 +0100
Change: 2009-03-18 12:55:31.000000000 +0100
The parameter --file-system produces details of the
properties of the file system in which the specified file is located:
tux > stat /etc/profile --file-system
  File: "/etc/profile"
    ID: d4fb76e70b4d1746 Namelen: 255     Type: ext2/ext3
Block size: 4096       Fundamental block size: 4096
Blocks: Total: 2581445    Free: 1717327    Available: 1586197
Inodes: Total: 655776     Free: 490312
2.9 User Information #Edit source
2.9.1 User Accessing Files: fuser #Edit source
It can be useful to determine what processes or users are currently
accessing certain files. Suppose, for example, you want to unmount a
file system mounted at /mnt.
umount returns "device is busy." The command
fuser can then be used to determine what processes
are accessing the device:
tux > fuser -v /mnt/*

                     USER        PID ACCESS COMMAND
/mnt/notes.txt       tux    26597 f....  less
Following termination of the less process, which was
running on another terminal, the file system can successfully be
unmounted. When used with -k option,
fuser will terminate processes accessing the file as
well.
2.9.2 Who Is Doing What: w #Edit source
With the command w, find out who is logged in to the
system and what each user is doing. For example:
tux > w
 16:00:59 up 1 day,  2:41,  3 users,  load average: 0.00, 0.01, 0.05
USER     TTY      FROM             LOGIN@   IDLE   JCPU   PCPU WHAT
tux      :0       console          Wed13   ?xdm?   8:15   0.03s /usr/lib/gdm/gd
tux      console  :0               Wed13   26:41m  0.00s  0.03s /usr/lib/gdm/gd
tux      pts/0    :0               Wed13   20:11   0.10s  2.89s /usr/lib/gnome-
If any users of other systems have logged in remotely, the parameter
-f shows the computers from which they have established
the connection.
2.10 Time and Date #Edit source
2.10.1 Time Measurement with time #Edit source
Determine the time spent by commands with the time
utility. This utility is available in two versions: as a Bash built-in
and as a program (/usr/bin/time).
tux > time find . > /dev/null

real    0m4.051s1
user    0m0.042s2
sys 0m0.205s3The real time that elapsed from the command's start-up until it finished. | |
CPU time of the user as reported by the | |
CPU time of the system as reported by the |
The output of /usr/bin/time is much more detailed.
It is recommended to run it with the -v switch to
produce human-readable output.
/usr/bin/time -v find . > /dev/null
        Command being timed: "find ."
        User time (seconds): 0.24
        System time (seconds): 2.08
        Percent of CPU this job got: 25%
        Elapsed (wall clock) time (h:mm:ss or m:ss): 0:09.03
        Average shared text size (kbytes): 0
        Average unshared data size (kbytes): 0
        Average stack size (kbytes): 0
        Average total size (kbytes): 0
        Maximum resident set size (kbytes): 2516
        Average resident set size (kbytes): 0
        Major (requiring I/O) page faults: 0
        Minor (reclaiming a frame) page faults: 1564
        Voluntary context switches: 36660
        Involuntary context switches: 496
        Swaps: 0
        File system inputs: 0
        File system outputs: 0
        Socket messages sent: 0
        Socket messages received: 0
        Signals delivered: 0
        Page size (bytes): 4096
        Exit status: 0
2.11 Graph Your Data: RRDtool #Edit source
There are a lot of data in the world around you, which can be easily measured in time. For example, changes in the temperature, or the number of data sent or received by your computer's network interface. RRDtool can help you store and visualize such data in detailed and customizable graphs.
RRDtool is available for most Unix platforms and Linux distributions. openSUSE® Leap ships RRDtool as well. Install it either with YaST or by entering
zypper install
rrdtool in the command line as root.
Tip: Bindings
There are Perl, Python, Ruby, and PHP bindings available for RRDtool, so that you can write your own monitoring scripts in your preferred scripting language.
2.11.1 How RRDtool Works #Edit source
RRDtool is an abbreviation of Round Robin Database tool. Round Robin is a method for manipulating with a constant amount of data. It uses the principle of a circular buffer, where there is no end nor beginning to the data row which is being read. RRDtool uses Round Robin Databases to store and read its data.
As mentioned above, RRDtool is designed to work with data that change in time. The ideal case is a sensor which repeatedly reads measured data (like temperature, speed etc.) in constant periods of time, and then exports them in a given format. Such data are perfectly ready for RRDtool, and it is easy to process them and create the desired output.
Sometimes it is not possible to obtain the data automatically and regularly. Their format needs to be pre-processed before it is supplied to RRDtool, and often you need to manipulate RRDtool even manually.
The following is a simple example of basic RRDtool usage. It illustrates all three important phases of the usual RRDtool workflow: creating a database, updating measured values, and viewing the output.
2.11.2 A Practical Example #Edit source
Suppose we want to collect and view information about the memory usage in the Linux system as it changes in time. To make the example more vivid, we measure the currently free memory over a period of 40 seconds in 4-second intervals. Three applications that usually consume a lot of system memory are started and closed: the Firefox Web browser, the Evolution e-mail client, and the Eclipse development framework.
2.11.2.1 Collecting Data #Edit source
RRDtool is very often used to measure and visualize network traffic. In such case, the Simple Network Management Protocol (SNMP) is used. This protocol can query network devices for relevant values of their internal counters. Exactly these values are to be stored with RRDtool. For more information on SNMP, see http://www.net-snmp.org/.
Our situation is different—we need to obtain the data
manually. A helper script free_mem.sh repetitively
reads the current state of free memory and writes it to the standard
output.
tux > cat free_mem.sh
INTERVAL=4
for steps in {1..10}
do
    DATE=`date +%s`
    FREEMEM=`free -b | grep "Mem" | awk '{ print $4 }'`
    sleep $INTERVAL
    echo "rrdtool update free_mem.rrd $DATE:$FREEMEM"
done
The time interval is set to 4 seconds, and is implemented with the
sleepcommand.RRDtool accepts time information in a special format - so called Unix time. It is defined as the number of seconds since the midnight of January 1, 1970 (UTC). For example, 1272907114 represents 2010-05-03 17:18:34.
The free memory information is reported in bytes with
free-b. Prefer to supply basic units (bytes) instead of multiple units (like kilobytes).The line with the
echo ...command contains the future name of the database file (free_mem.rrd), and together creates a command line for updating RRDtool values.
After running free_mem.sh, you see an output similar
to this:
tux > sh free_mem.sh
rrdtool update free_mem.rrd 1272974835:1182994432
rrdtool update free_mem.rrd 1272974839:1162817536
rrdtool update free_mem.rrd 1272974843:1096269824
rrdtool update free_mem.rrd 1272974847:1034219520
rrdtool update free_mem.rrd 1272974851:909438976
rrdtool update free_mem.rrd 1272974855:832454656
rrdtool update free_mem.rrd 1272974859:829120512
rrdtool update free_mem.rrd 1272974863:1180377088
rrdtool update free_mem.rrd 1272974867:1179369472
rrdtool update free_mem.rrd 1272974871:1181806592
It is convenient to redirect the command's output to a file with
sh free_mem.sh > free_mem_updates.log
to simplify its future execution.
2.11.2.2 Creating the Database #Edit source
Create the initial Robin Round database for our example with the following command:
tux > rrdtool create free_mem.rrd --start 1272974834 --step=4 \
DS:memory:GAUGE:600:U:U RRA:AVERAGE:0.5:1:24
Points to Notice #
This command creates a file called
free_mem.rrdfor storing our measured values in a Round Robin type database.The
--startoption specifies the time (in Unix time) when the first value will be added to the database. In this example, it is one less than the first time value of thefree_mem.shoutput (1272974835).The
--stepspecifies the time interval in seconds with which the measured data will be supplied to the database.The
DS:memory:GAUGE:600:U:Upart introduces a new data source for the database. It is called memory, its type is gauge, the maximum number between two updates is 600 seconds, and the minimal and maximal value in the measured range are unknown (U).RRA:AVERAGE:0.5:1:24creates Round Robin archive (RRA) whose stored data are processed with the consolidation functions (CF) that calculates the average of data points. 3 arguments of the consolidation function are appended to the end of the line.
If no error message is displayed, then
free_mem.rrd database is created in the current
directory:
tux > ls -l free_mem.rrd
-rw-r--r-- 1 tux users 776 May  5 12:50 free_mem.rrd
2.11.2.3 Updating Database Values #Edit source
After the database is created, you need to fill it with the measured
data. In Section 2.11.2.1, “Collecting Data”, we already
prepared the file free_mem_updates.log which
consists of rrdtool update commands. These commands
do the update of database values for us.
tux > sh free_mem_updates.log; ls -l free_mem.rrd
-rw-r--r--  1 tux users  776 May  5 13:29 free_mem.rrd
As you can see, the size of free_mem.rrd remained
the same even after updating its data.
2.11.2.4 Viewing Measured Values #Edit source
We have already measured the values, created the database, and stored the measured value in it. Now we can play with the database, and retrieve or view its values.
To retrieve all the values from our database, enter the following on the command line:
tux > rrdtool fetch free_mem.rrd AVERAGE --start 1272974830 \
--end 1272974871
          memory
1272974832: nan
1272974836: 1.1729059840e+09
1272974840: 1.1461806080e+09
1272974844: 1.0807572480e+09
1272974848: 1.0030243840e+09
1272974852: 8.9019289600e+08
1272974856: 8.3162112000e+08
1272974860: 9.1693465600e+08
1272974864: 1.1801251840e+09
1272974868: 1.1799787520e+09
1272974872: nan
Points to Notice #
AVERAGEwill fetch average value points from the database, because only one data source is defined (Section 2.11.2.2, “Creating the Database”) withAVERAGEprocessing and no other function is available.The first line of the output prints the name of the data source as defined in Section 2.11.2.2, “Creating the Database”.
The left results column represents individual points in time, while the right one represents corresponding measured average values in scientific notation.
The
nanin the last line stands for “not a number”.
Now a graph representing the values stored in the database is drawn:
tux > rrdtool graph free_mem.png \
--start 1272974830 \
--end 1272974871 \
--step=4 \
DEF:free_memory=free_mem.rrd:memory:AVERAGE \
LINE2:free_memory#FF0000 \
--vertical-label "GB" \
--title "Free System Memory in Time" \
--zoom 1.5 \
--x-grid SECOND:1:SECOND:4:SECOND:10:0:%X
Points to Notice #
free_mem.pngis the file name of the graph to be created.--startand--endlimit the time range within which the graph will be drawn.--stepspecifies the time resolution (in seconds) of the graph.The
DEF:...part is a data definition called free_memory. Its data are read from thefree_mem.rrddatabase and its data source called memory. The average value points are calculated, because no others were defined in Section 2.11.2.2, “Creating the Database”.The
LINE...part specifies properties of the line to be drawn into the graph. It is 2 pixels wide, its data come from the free_memory definition, and its color is red.--vertical-labelsets the label to be printed along the y axis, and--titlesets the main label for the whole graph.--zoomspecifies the zoom factor for the graph. This value must be greater than zero.--x-gridspecifies how to draw grid lines and their labels into the graph. Our example places them every second, while major grid lines are placed every 4 seconds. Labels are placed every 10 seconds under the major grid lines.
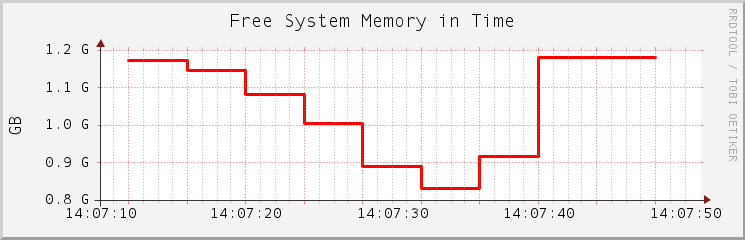
Figure 2.1: Example Graph Created with RRDtool #
2.11.3 For More Information #Edit source
RRDtool is a very complex tool with a lot of sub-commands and command line options. Some are easy to understand, but to make it produce the results you want and fine-tune them according to your liking may require a lot of effort.
Apart from RRDtool's man page (man 1 rrdtool) which
gives you only basic information, you should have a look at the
RRDtool home
page. There is a detailed
documentation
of the rrdtool command and all its sub-commands.
There are also several
tutorials
to help you understand the common RRDtool workflow.
If you are interested in monitoring network traffic, have a look at MRTG (Multi Router Traffic Grapher). MRTG can graph the activity of many network devices. It can use RRDtool.